The world celebrated June 05, 2019 as the World Environment Day (WED 2019), and the theme this year was “Air Pollution”. China, once famous for its smoggy skies and extremely polluted air was the global host, while back home in India, Ministry of Environment, Forests & Climate Change (MoEFCC), in partnership with Bhamla Foundation had roped in people from the entertainment industry to come up with a campaign song titled “Hawa Aane De (Let the Air Come)”. MoEFCC also came up with a #SelfieWithSapling campaign urging Indians to plant trees and care for them (I request you to please take care of them like your own child if you have planted any saplings). In January this year, MoEFCC had released India’s first ever nationwide plan to combat air pollution, the National Clean Air Programme (NCAP), which has been critiqued for lack of ambition to set strong reduction targets and for lacking a strong financial and statutory framework.
There was resentment that 139 cities were left out of the list of non-attainment cities in the NCAP. The list was drawn up based on old data from 2015, even though more recent data (up to 2017) is available, as observed by Greenpeace in their Airpocalypse-III report. According to government data available, there are 241 non-attainment cities in India, of which only Thoothukudi features in the NCAP list of non-attainment cities. Cuddalore, classified as critically polluted in the government's own Comprehensive Environmental Pollution Index (CEPI), and Chennai, which ranked number 2 in terms of emissions and energy consumption for urban commute in a report by the Centre for Science and Environment (CSE), are surprising omissions.
Air quality monitoring is the essential first step in efforts to curb air pollution as it enables us with crucial data to identify areas requiring attention and to measure our progress. With this in mind, we started to deploy outdoor air quality monitors (AQM) for continuous monitoring of particulate matter (PM) of size 2.5 micrometer and 10 micrometer or less, respectively. The smaller the size of particle, the deeper it can penetrate into our body and thus cause more harm. An interactive webpage by The Guardian details the harm caused by particulate matter exposure to each organ of our body.
Monitors were installed in urban, peri-urban and rural areas in different parts of Tamil Nadu, namely:
- Alwarpet, an upscale urban locality in Chennai,
- Kovilambakkam, a peri-urban locality in South-West Chennai,
- Pudukuppam, a coastal village bordering a thermal power plant in Cuddalore district (Figure 1).
Pudukuppam is a small fishing village between a 1,200 MW power plant owned and operated by IL&FS Tamil Nadu Power Company Limited (ITPCL) and the Bay of Bengal. The village is close to the coal unloading and storage area of the power plant and the coal dust problem in the villages has been reported on previously. During the study period, because the wind direction was from sea to land (Eastern winds), coal dust was not flowing to the village.
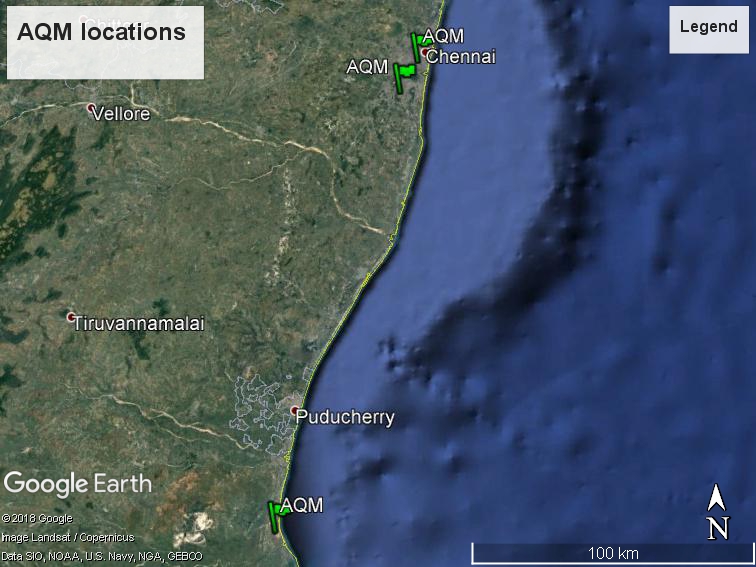
Figure 1: Location of AQM in Chennai and Cuddalore
These AQMs measure the levels of PM 2.5 and PM 10 in µg/m3 of ambient air, using the laser scattering principle to determine particle size. The real time air quality data from all the monitors can be viewed here. The raw data can be obtained by sending a request mail to tpp@cag.org.in.
The readings obtained from AQMs are graded according to the Indian Air Quality Index (Indian AQI) and corresponding health impacts, as prescribed by the MoEFCC (Table 1: adapted from NCAP page 12, table 3). Central Pollution Control Board (CPCB) has notified National Ambient Air Quality Standards (NAAQS) for industrial/residential/rural areas and for ecologically sensitive areas (as notified by the Central Government). According to the notification, 24 hourly monitored values have to be within the prescribed limits 98% of the time in a year and can exceed the values 2% of the time in a year but not on two consecutive days of monitoring. Whenever and wherever the monitoring results on two consecutive days of monitoring exceed the limits specified for respective categories, it is enough to institute regular continuous monitoring and further investigations. The concentration limit in ambient air for PM 10 and PM 2.5 for 24 hour averaged monitoring values are 100 µg/m3 and 60 µg/m3 respectively.
We have analysed the data for 4 months from January 2019 to April 2019, in two different ways: firstly, we have analysed the 24 hour averaged data for each day from January 01, 2019 to April 30, 2019 in line with the NAAQS guidelines. Then, we have also analysed the data by dividing the 24 hour period to four equal periods of 6 hours averaged data for each day in the four month period. This is done to observe any specific intraday trends in the ambient air quality at the three locations. This data is of interest to draw insights on the impact of temporal variations in a short time frame, on human health. Thus, the results discussed below will reflect the overall trend in levels of PM 2.5 and PM 10, and the AQI (which is calculated as the maximum subindex of the individual PM values) for four months, based on the daily averages of the readings.

Table 1: Indian AQI and corresponding health impacts
Results and discussion:
24 hour averaged daily data: In all the three locations, the trends for PM 2.5, PM 10 and AQI indicate that irrespective of the differences among the locations, in terms of green cover, human population, presence of industry or number of vehicles, the three locations have recorded similar air quality. All three locations recorded daily averages for PM 2.5, PM 10 and AQI for the month of January, as moderate or worse (Figure 2A, 2B, 2C). This means that all residents of these areas are at risk, with the children, elderly and asthmatics being the most vulnerable, during that time of the year. The daily averages move to good or satisfactory levels from February and have remained so till April 2019. Lower atmospheric temperature in January, which makes pollutants move slowly, combined with the widespread burning during the Bhogi festival celebrations across the state, could be the reason for the higher levels of pollutants in January across all three locations. The peak for levels of PM 2.5 and PM 10 on January 14, 15 and 16 lends strong credence to the link between Bhogi festival and increased PM in the air. The data from our monitors is in sync with the data recorded on the government monitors in Chennai during Bhogi festival.
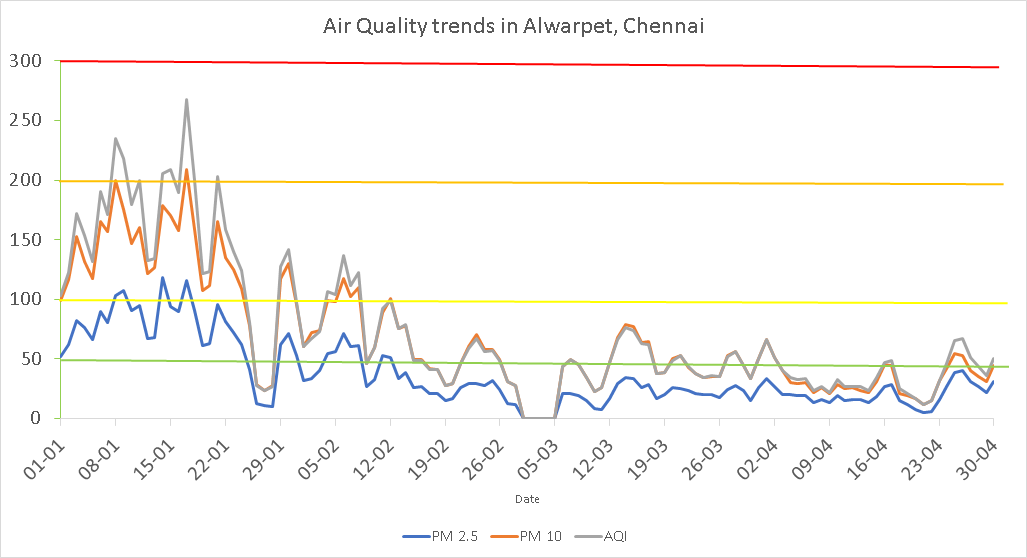
Figure 2A*: PM 2.5, PM 10 and AQI daily averages from January 01, 2019 to April 30, 2019 in Alwarpet, Chennai.
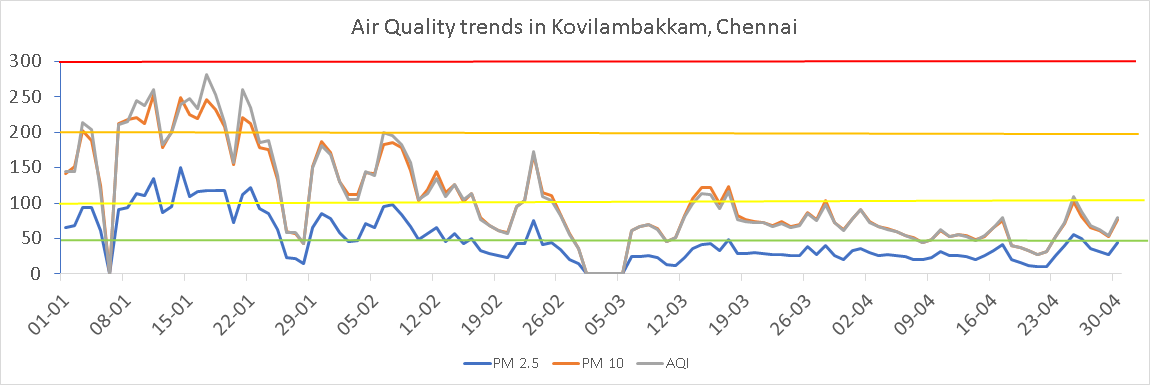
Figure 2B*: PM 2.5, PM 10 and AQI daily averages from January 01, 2019 to April 30, 2019 in Kovilambakkam, Chennai.
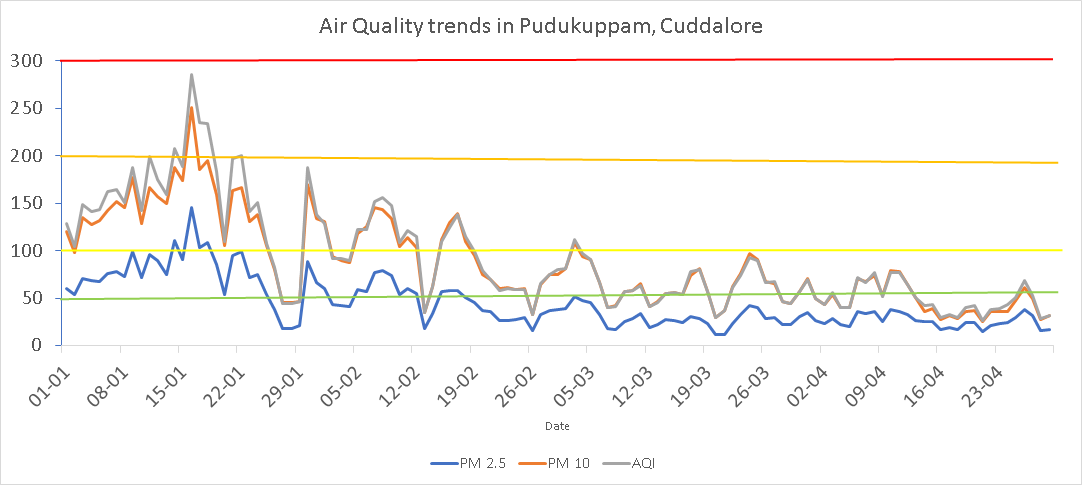
Figure 2C: PM 2.5, PM 10 and AQI daily averages from January 01, 2019 to April 30, 2019 in Pudukuppam, Cuddalore.
*: The troughs seen in figure 2A and 2B between February 28 and March 05 are due to unavailability of data on those days.
Table 2 shows the total number of days in each AQI category during the study period. Only Alwarpet, the upscale urban locality with decent tree cover in Chennai, has 49 percent of days with good AQI, while Kovilambakkam has the lowest percentage of days with good AQI at 11 percent. Being a suburban area, Kovilambakkam has many ongoing construction projects, reducing tree cover, and dusty mud roads which could explain this. Pudhukuppam village, with higher tree cover and lower population density compared to the other two locations, should have a higher percentage of good AQI days, but has only 26 percent of good AQI days. The village defies this expectation of higher days with good AQI, and basal level of dust and coal particles from the coal storage yard of the power plant could be responsible for the same. All the three locations were found to exceed the limits specified under NAAQS on more than 2 consecutive days 10 times or more just in the month of January. Thus, all the three locations warrant immediate attention and more continuous monitoring equipment to be deployed. Our AQMs measure only two of the twelve pollutants listed in NAAQS.
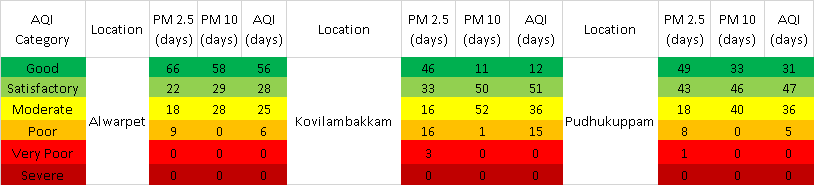
Table 2: Number of days of each AQI category from January 01, 2019 to April 30, 2019.
6 hour averaged intraday data: The devices installed at the three locations record real time data, and we took hourly averages from the server and divided a day into four zones of 6 hours each starting from an hour post midnight. After averaging the values by 6 hourly intervals, we observed the data to understand AQI distribution in each location in each of the four months. Here again, similar to our findings in daily averages , the AQI is moderate or worse in January; we also gather additional information that PM 2.5 and PM 10 peaks during two time intervals, one between 01:00 AM and 07:00 AM and the next between 07:00 AM and 1:00 PM. For Pudukuppam, the peak in PM 2.5 and PM 10 is strongest during the 01:00 AM to 07:00 AM time window for January 2019, while for the remaining three months, the AQI is consistently at good or satisfactory levels. For Kovilambakkam, we identified PM 10 as the major pollutant whenever the overall AQI is at satisfactory or worse level. Alwarpet has had consistently good or satisfactory AQI for the months of March and April, while the 1st week of February recorded a few day time peaks to moderate and poor AQI levels corresponding to the dates when a borewell was being dug in the neighbourhood.
Conclusion:
We have attempted to cover the lacunae in air quality monitoring which is urban centric, by setting up AQMs in peri-urban and rural areas. This has given us unique insights into the expanse of the air pollution. It was revealed that seasonal and cultural factors have a strong influence on air quality across different localities. The data from Kovilambakkam is a strong pointer towards the worsening of air quality and increasing built infrastructure due to expanding cities. The need for multiple monitors around industries like the ITPCL power plant is evident from the readings in Pudukuppam village. It will be interesting to see the air quality once the wind direction changes and the wind blows from land to the sea. A common trend visible in all three locations is that the air quality is best during 1:00 PM to 7:00 PM interval and worst during 1:00 AM to 7:00 AM interval. It is vital to validate if this trend continues at more locations, and analyse anthropogenic and natural atmospheric factors responsible for the same. This can give insights to residents and policymakers on deciding the intervention strategies to combat air pollution.
More AQMs have been set up by us at few more locations and it will soon be possible to do a more comprehensive study with the aim of collecting monitoring data to better inform policy decisions to combat air pollution.